?WHY IS
RENT HIGH?
Why rent is highSolutionsEvidenceChartsLibrary
Take action
HomeWhy rent is highSolutionsEvidenceChartsLibraryTake action
  1. Charts
  2. New supply lowers rents across the quality distribution.
?WHY IS
RENT HIGH?
New supply → rents

New supply lowers rents across the quality distribution.

Every rent-quality decile has a negative estimate; the vertical bars show 95% confidence intervals.

FROM THE PAPERFigure 3 · Impact of new housing supply on the distribution of rents
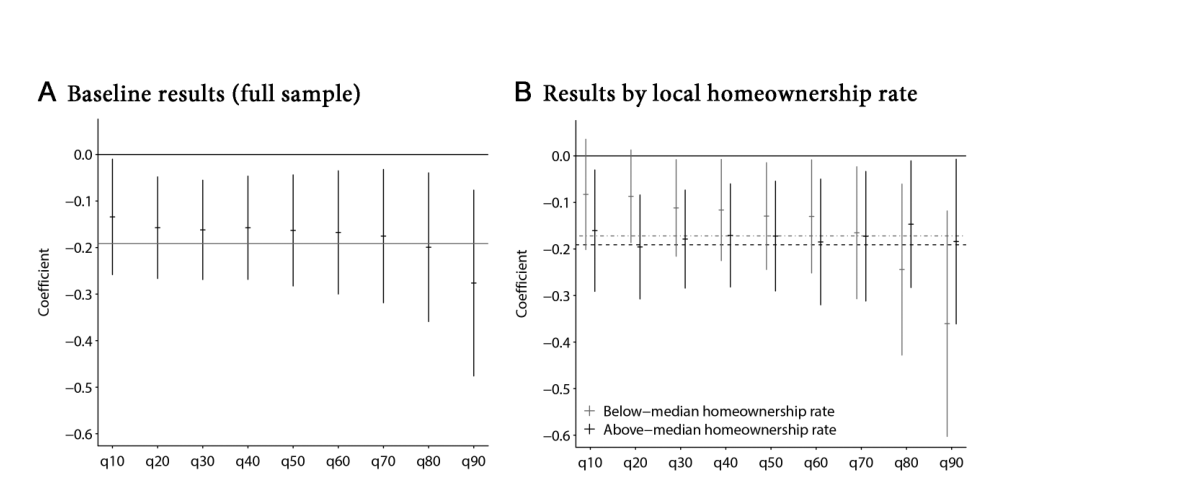
Published two-panel coefficient plot showing negative rent effects from new housing supply across nine rent-quality deciles and by local homeownership rate.

Source: Mense (2025) · Figure 3; PDF p. 20

Keep in mind: The setting is Germany and the outcome is quality-adjusted posted rent rather than contract rent.

Share the evidence

New supply lowers rents across the quality distribution.

Every rent-quality decile has a negative estimate; the vertical bars show 95% confidence intervals.

Source
Mense (2025)
Figure
Figure 3 · Impact of new housing supply on the distribution of rents · Figure 3; PDF p. 20
Keep in mind
The setting is Germany and the outcome is quality-adjusted posted rent rather than contract rent.
Download PNGRead study notesBrowse all charts →
?WHY IS
RENT HIGH?

Too many people are chasing too few homes. See why—and what communities can do about it.

HomeWhy rent is highSolutionsEvidenceChartsResearch libraryCommon questionsTake action