?WHY IS
RENT HIGH?
Why rent is highSolutionsEvidenceChartsLibrary
Take action
HomeWhy rent is highSolutionsEvidenceChartsLibraryTake action
  1. Charts
  2. The most expensive markets often issued the fewest permits.
?WHY IS
RENT HIGH?
Supply responsiveness

The most expensive markets often issued the fewest permits.

High price-to-cost ratios cluster toward the low-permitting side of the metropolitan comparison.

FROM THE PAPERFigure 8 · Price-to-cost ratios and permitting
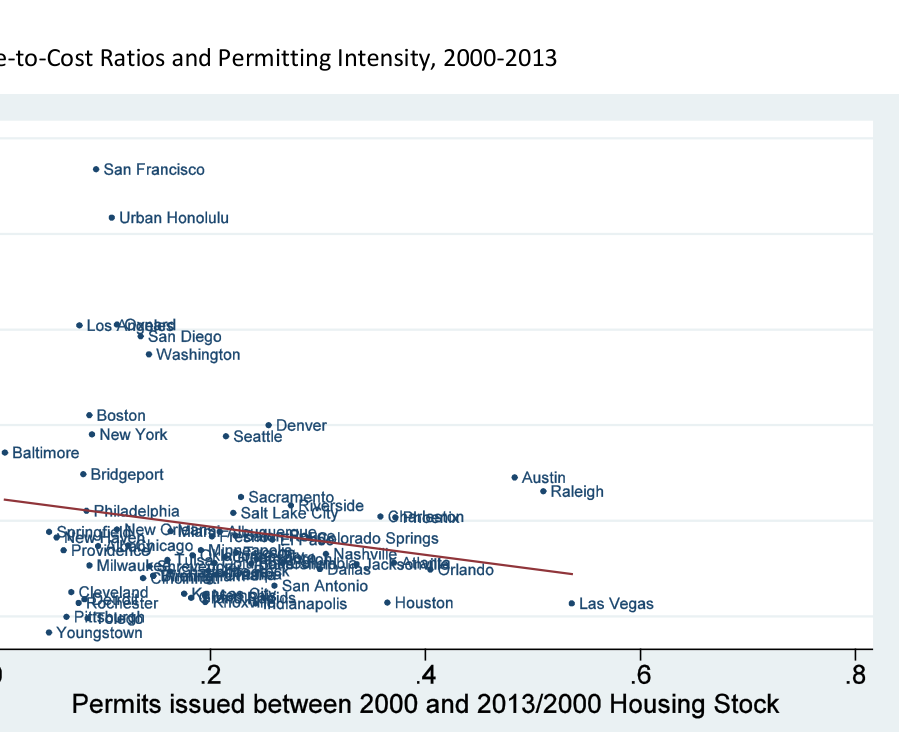
Published metropolitan scatterplot of house price-to-cost ratios against permits issued relative to the housing stock.

Source: Glaeser & Gyourko (2018) · Figure 8; PDF p. 37

Keep in mind: Metros differ in geography, amenities, and demand; this cross-section is evidence of a pattern, not a causal effect.

Share the evidence

The most expensive markets often issued the fewest permits.

High price-to-cost ratios cluster toward the low-permitting side of the metropolitan comparison.

Source
Glaeser & Gyourko (2018)
Figure
Figure 8 · Price-to-cost ratios and permitting · Figure 8; PDF p. 37
Keep in mind
Metros differ in geography, amenities, and demand; this cross-section is evidence of a pattern, not a causal effect.
Download PNGRead study notesBrowse all charts →
?WHY IS
RENT HIGH?

Too many people are chasing too few homes. See why—and what communities can do about it.

HomeWhy rent is highSolutionsEvidenceChartsResearch libraryCommon questionsTake action