Legal capacity
Strong evidenceA city cannot build homes it has made illegal.
Legalize real projects across enough land and builders respond. Auckland did this at city scale and saw a large permitting boom; narrower reforms have usually delivered less.
Figures from the papers
Inspect the published evidence directly
Figure 2 · Living space after upzoning
The strongest post-reform increases appear after roughly five years, especially for large upzonings.
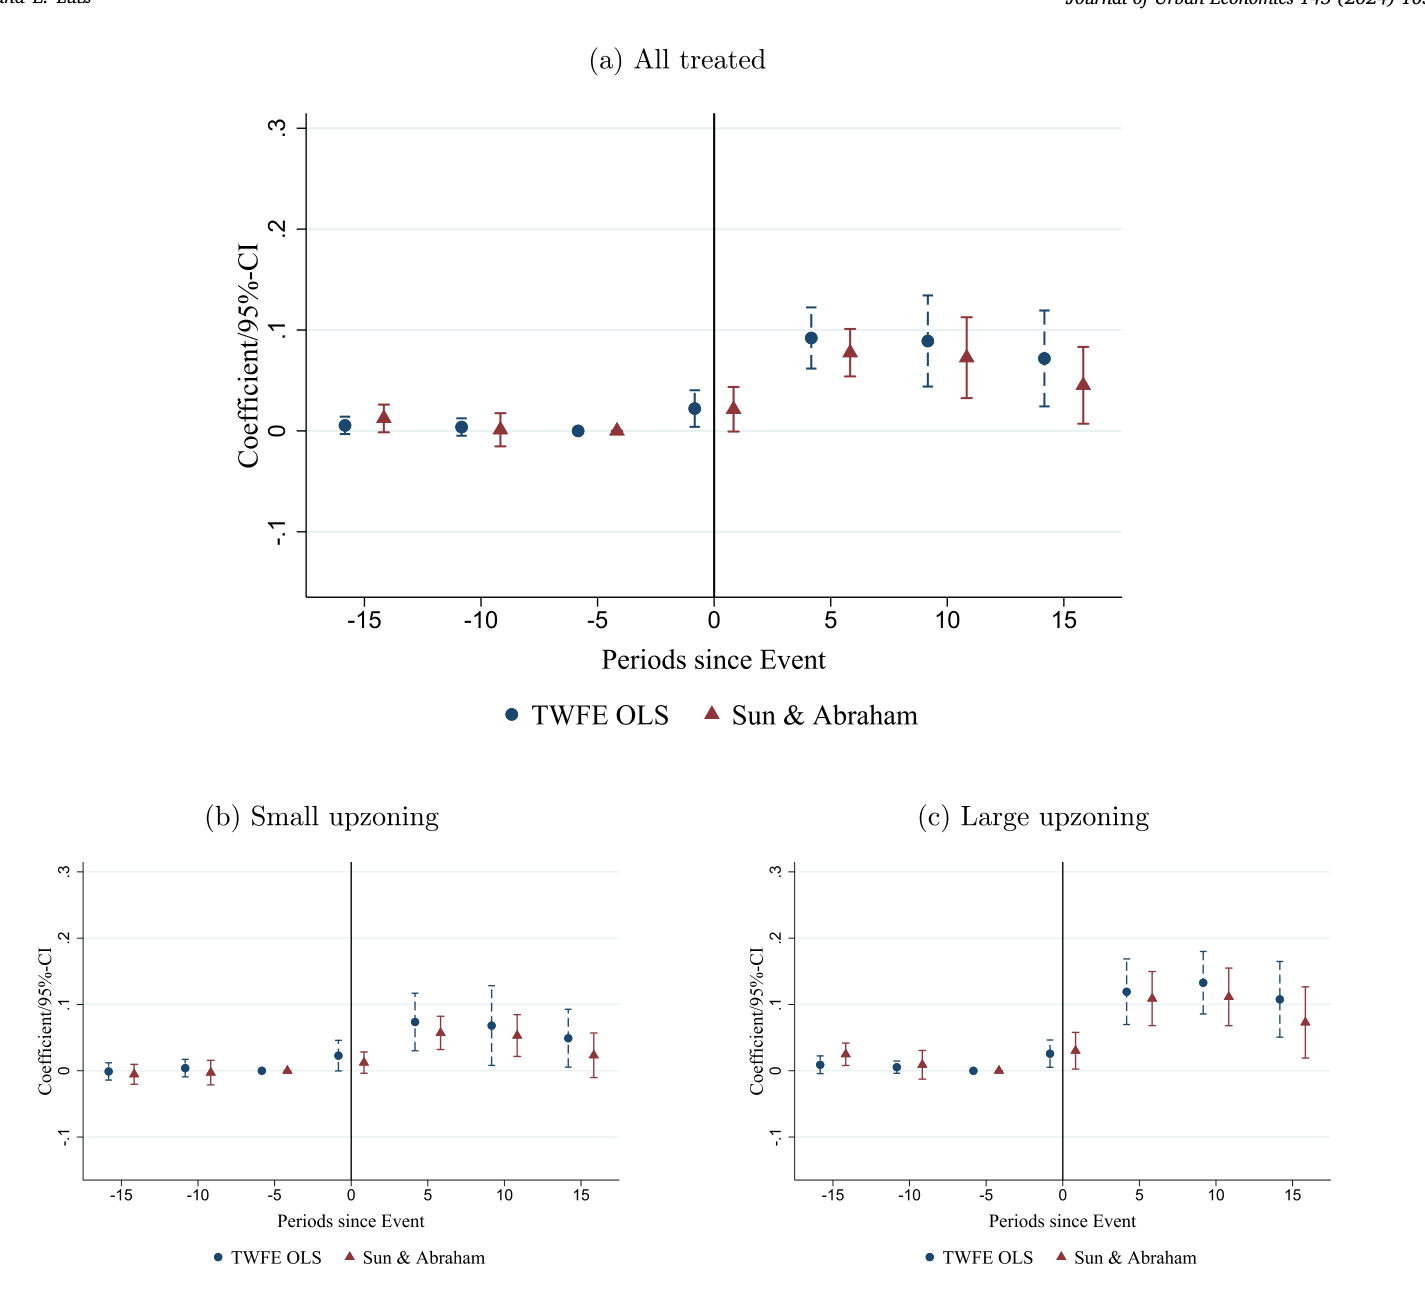
Figure 6 · Estimated treatment effects on dwelling permits
The estimated effects become positive after the reform for both attached and detached homes.
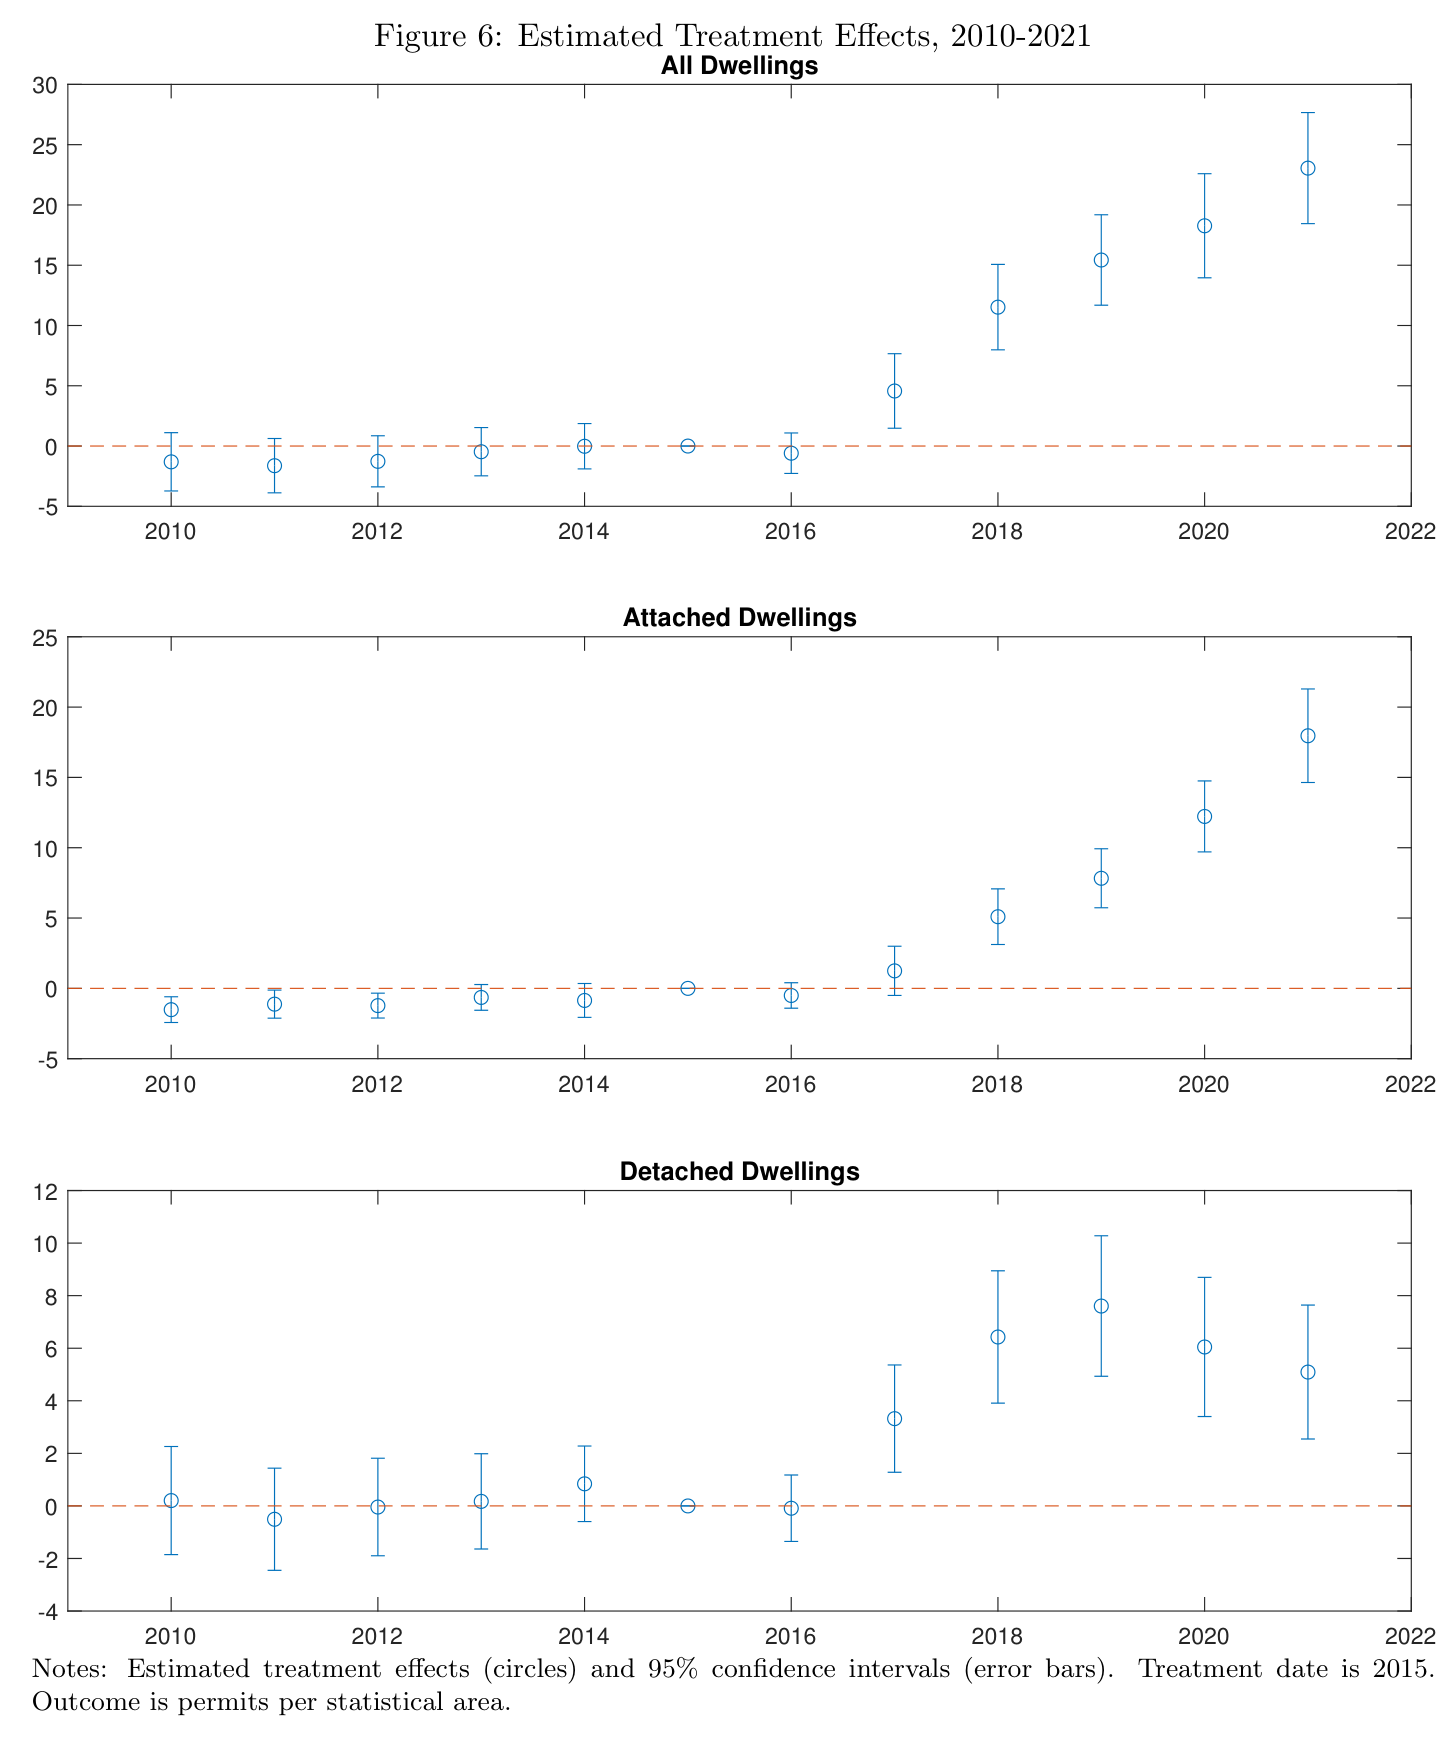
Figure 2 · Average number of addresses before and after reform
The two groups track similarly before reform and separate gradually afterward.
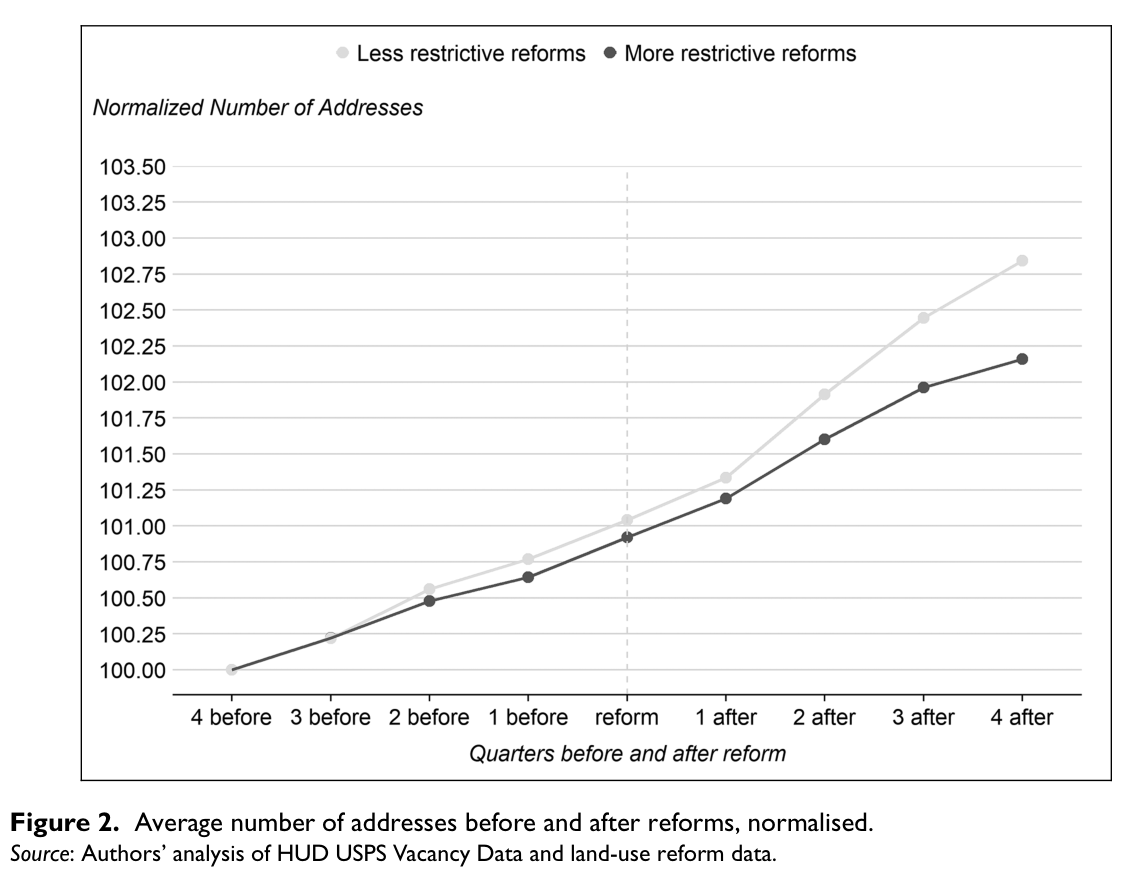
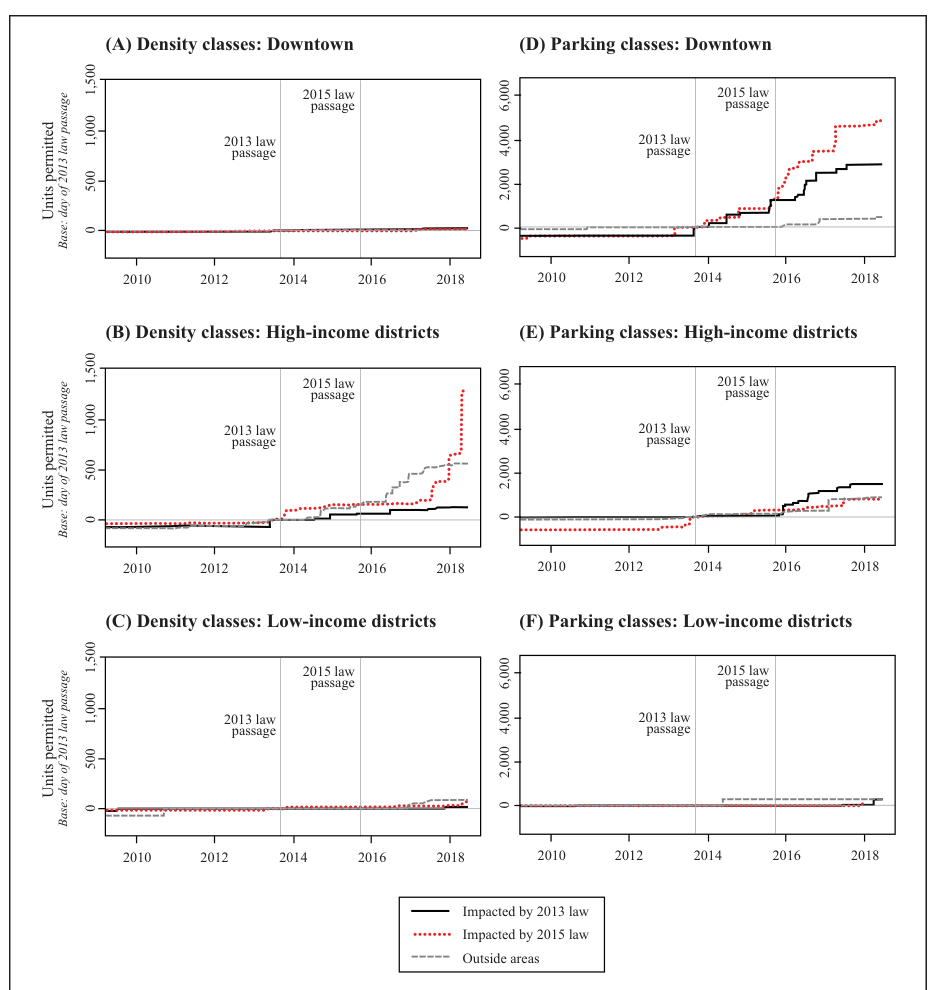
Figure 3 · Cumulative residential units permitted
Chicago's cumulative permit paths changed unevenly across neighborhoods and rule types.
Evidence stack
Studies behind this conclusion
The Impact of Upzoning on Housing Construction in Auckland
A broad reform covering roughly three quarters of residential land produced a large increase in permitted homes relative to non-upzoned areas.
21,808 additional permitted homes over five years
Keep in mind: Permits are not the same as completed or net new occupied homes.
Study details →Estimating the Economic Value of Zoning Reform
Allowing more floor area increased multifamily development activity and availability; the authors' equilibrium model predicts a larger housing stock and lower prices over time.
Modeled long run: 1.9% more housing and 0.5% lower prices citywide
Keep in mind: The price figures are structural simulations, not direct rent estimates, and the reform produced gains and losses for different owners and residents.
Study details →Making Housing Affordable? The Local Effects of Relaxing Land-Use Regulation
Substantial upzonings increased housing over five to ten years, especially where prior zoning was binding and rents signaled strong demand.
About 9% more living space and housing units in upzoned areas after five to ten years
Keep in mind: Local quality-adjusted rents did not differ significantly from later-upzoned controls; effects may diffuse across the wider market, and the setting is one Swiss canton.
Study details →Land-Use Reforms and Housing Costs
Loosening reforms were followed by modest average supply gains, while tightening reforms reduced middle-income-affordable units and raised rents.
Loosening was associated with 0.8% more housing after 3–9 years
Keep in mind: Reforms are heterogeneous and the cross-city design remains observational.
Study details →Upzoning Chicago
Narrow transit-area upzonings raised affected property values but did not produce detectable additional housing during the five-year study window.
Keep in mind: A localized reform and limited horizon may behave differently from broad reform.
Study details →From evidence to policy